 Continuing the series on Planning we will now look at creating timelines.
Timelines
A timeline is a critical ‘driver’ in achieving the end goal. Like a map it provides a constant reference against which progress towards a target can be measured at any point in the journey. It is a monitoring tool. And so it is worth taking sufficient time and effort in creating it to ensure that it is realistic.
There are various ways of producing a timeline but I will consider two here: an Activity Table and a Bar Chart. I have found that the first helps me with planning an event where there are critical dates by which certain activities must be achieved, such as a conference. The second is more visual and is valuable where there is a lot of interaction between activities and where the processes have to be carried out in the right order. Two examples would be putting up a building or, on a somewhat smaller scale, creating a piece of literature.
Activity Table
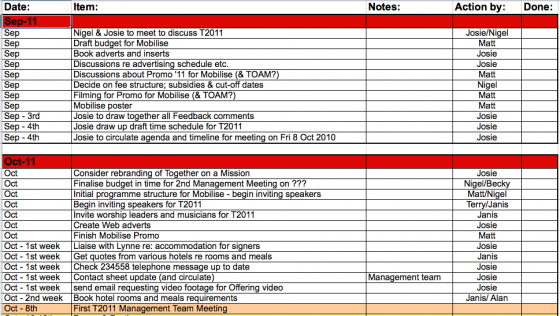
When planning and implementing the necessary activities to achieve our annual leaders conference, Together on a Mission, I find the Activity Table serves me well.
- It allows all members of the Management Team to include their particular activities and to see how they relate to others.
- It provides a ready monitor for each Team meeting against which actions may be checked.

Points to note:
- It is clear who has responsibility for any particular action
- Monitoring of progress is built in to the Table
Bar Chart
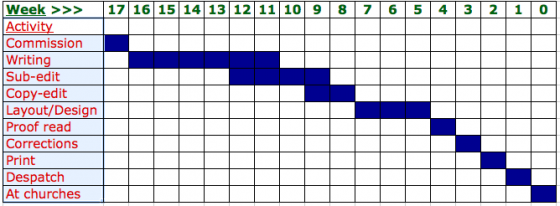
 Since this depicts time it is best constructed horizontally. There are various software packages for Gantt charts etc but a simple Bar Chart may be constructed using Excel or equivalent. Here is an example based on the production of the Newfrontiers quarterly Magazine.

Points to note:
- A Bar Chart is better than an Activity Table for showing visually the flow of work, particularly the interaction between different activities or processes. This is particular helpful where there are different people involved in carrying out the various tasks. Sometimes an activity that does not seem urgent to the individual will have ‘knock on’ consequences if that person misses the deadline. So, it is important to identify any clash of requirements and define the critical path, where necessary, to ensure deadlines are met, the necessary resources are available at the appropriate time and so on. This is more clearly apparent in the Bar Chart than on an Activity Table where there is a continuous flow through the time it represents.
- The weeks here are shown as a ‘countdown’ to the end point. This works well when constructing a template for a repetitive task (as in this example – a regular publication) but dates must be inserted to replace the Week numbers for any particular project.
- There will, of course, be occasions when the timescale needs changing – days or, perhaps, months.
We have now considered four distinct stages in planning:
- Vision and Goal setting
- Gathering ideas
- Ordering thoughts
- Timeline
Implementation can now be initiated.
